How to draw a line around a bunch of boxes
A deep dive into the geometry behind grouping sticky notes on a whiteboard — convex hulls, proximity detection, and 7 years of iteration.
A couple of years ago, during a feedback call, a customer was telling us how much they liked the Topic Tool in Ludi. I clearly remember him saying:
It’s so cool — I’m a backend dev, so drawing a line around a bunch of boxes… I have no idea how you do that!
That conversation inspired this article, in which I’ll walk through how I built the topic tool and the iterations it’s been through.
What’s a Topic?
In Ludi, a Topic is an element used for grouping related sticky notes or cards together. When groupable objects are placed nearby, it automatically draws a curvy line around them. It feels natural to use and is great for visually segmenting information.
Give them a try below:
To make Topics work, we use a combination of techniques and algorithms that I’ve iterated on over the years. I’ll walk through how it all works and how we’ve improved it.
Background
Ludi launched a few years ago as Metro Retro, a whiteboard tool for running retrospectives. Some early users let me sit in on their meetings, during which I noticed they were regularly clustering sticky notes together by theme, with a text label to describe the group.
Excited by this emerging behavior, I set about designing a feature to help users formalise this behavior. The objective was to create a new element type that would fulfil the following requirements:
- Enable users to visually group sticky notes together
- Feel natural to use and be powered just by drag and drop
- Be visually recognisable as a group
- Not be slow and buggy (like duh)
My solution was an element that captured stickies when moved nearby, then drew a nice looking line around them. For this, I needed to solve two sub-problems:
- How do we identify when one sticky is “near” a Topic element?
- How do we draw a line around them?
Problem 1: Relating Stickies to Topics
In the picture below, there’s a bunch of Stickies grouped under a Topic on the left, and a few on the right that aren’t. Imagine the Topic border isn’t visible. It’s obvious to us that the left group is clustered around the Topic and the right ones aren’t. Our brains are great at this, but how do we make a computer do the same?
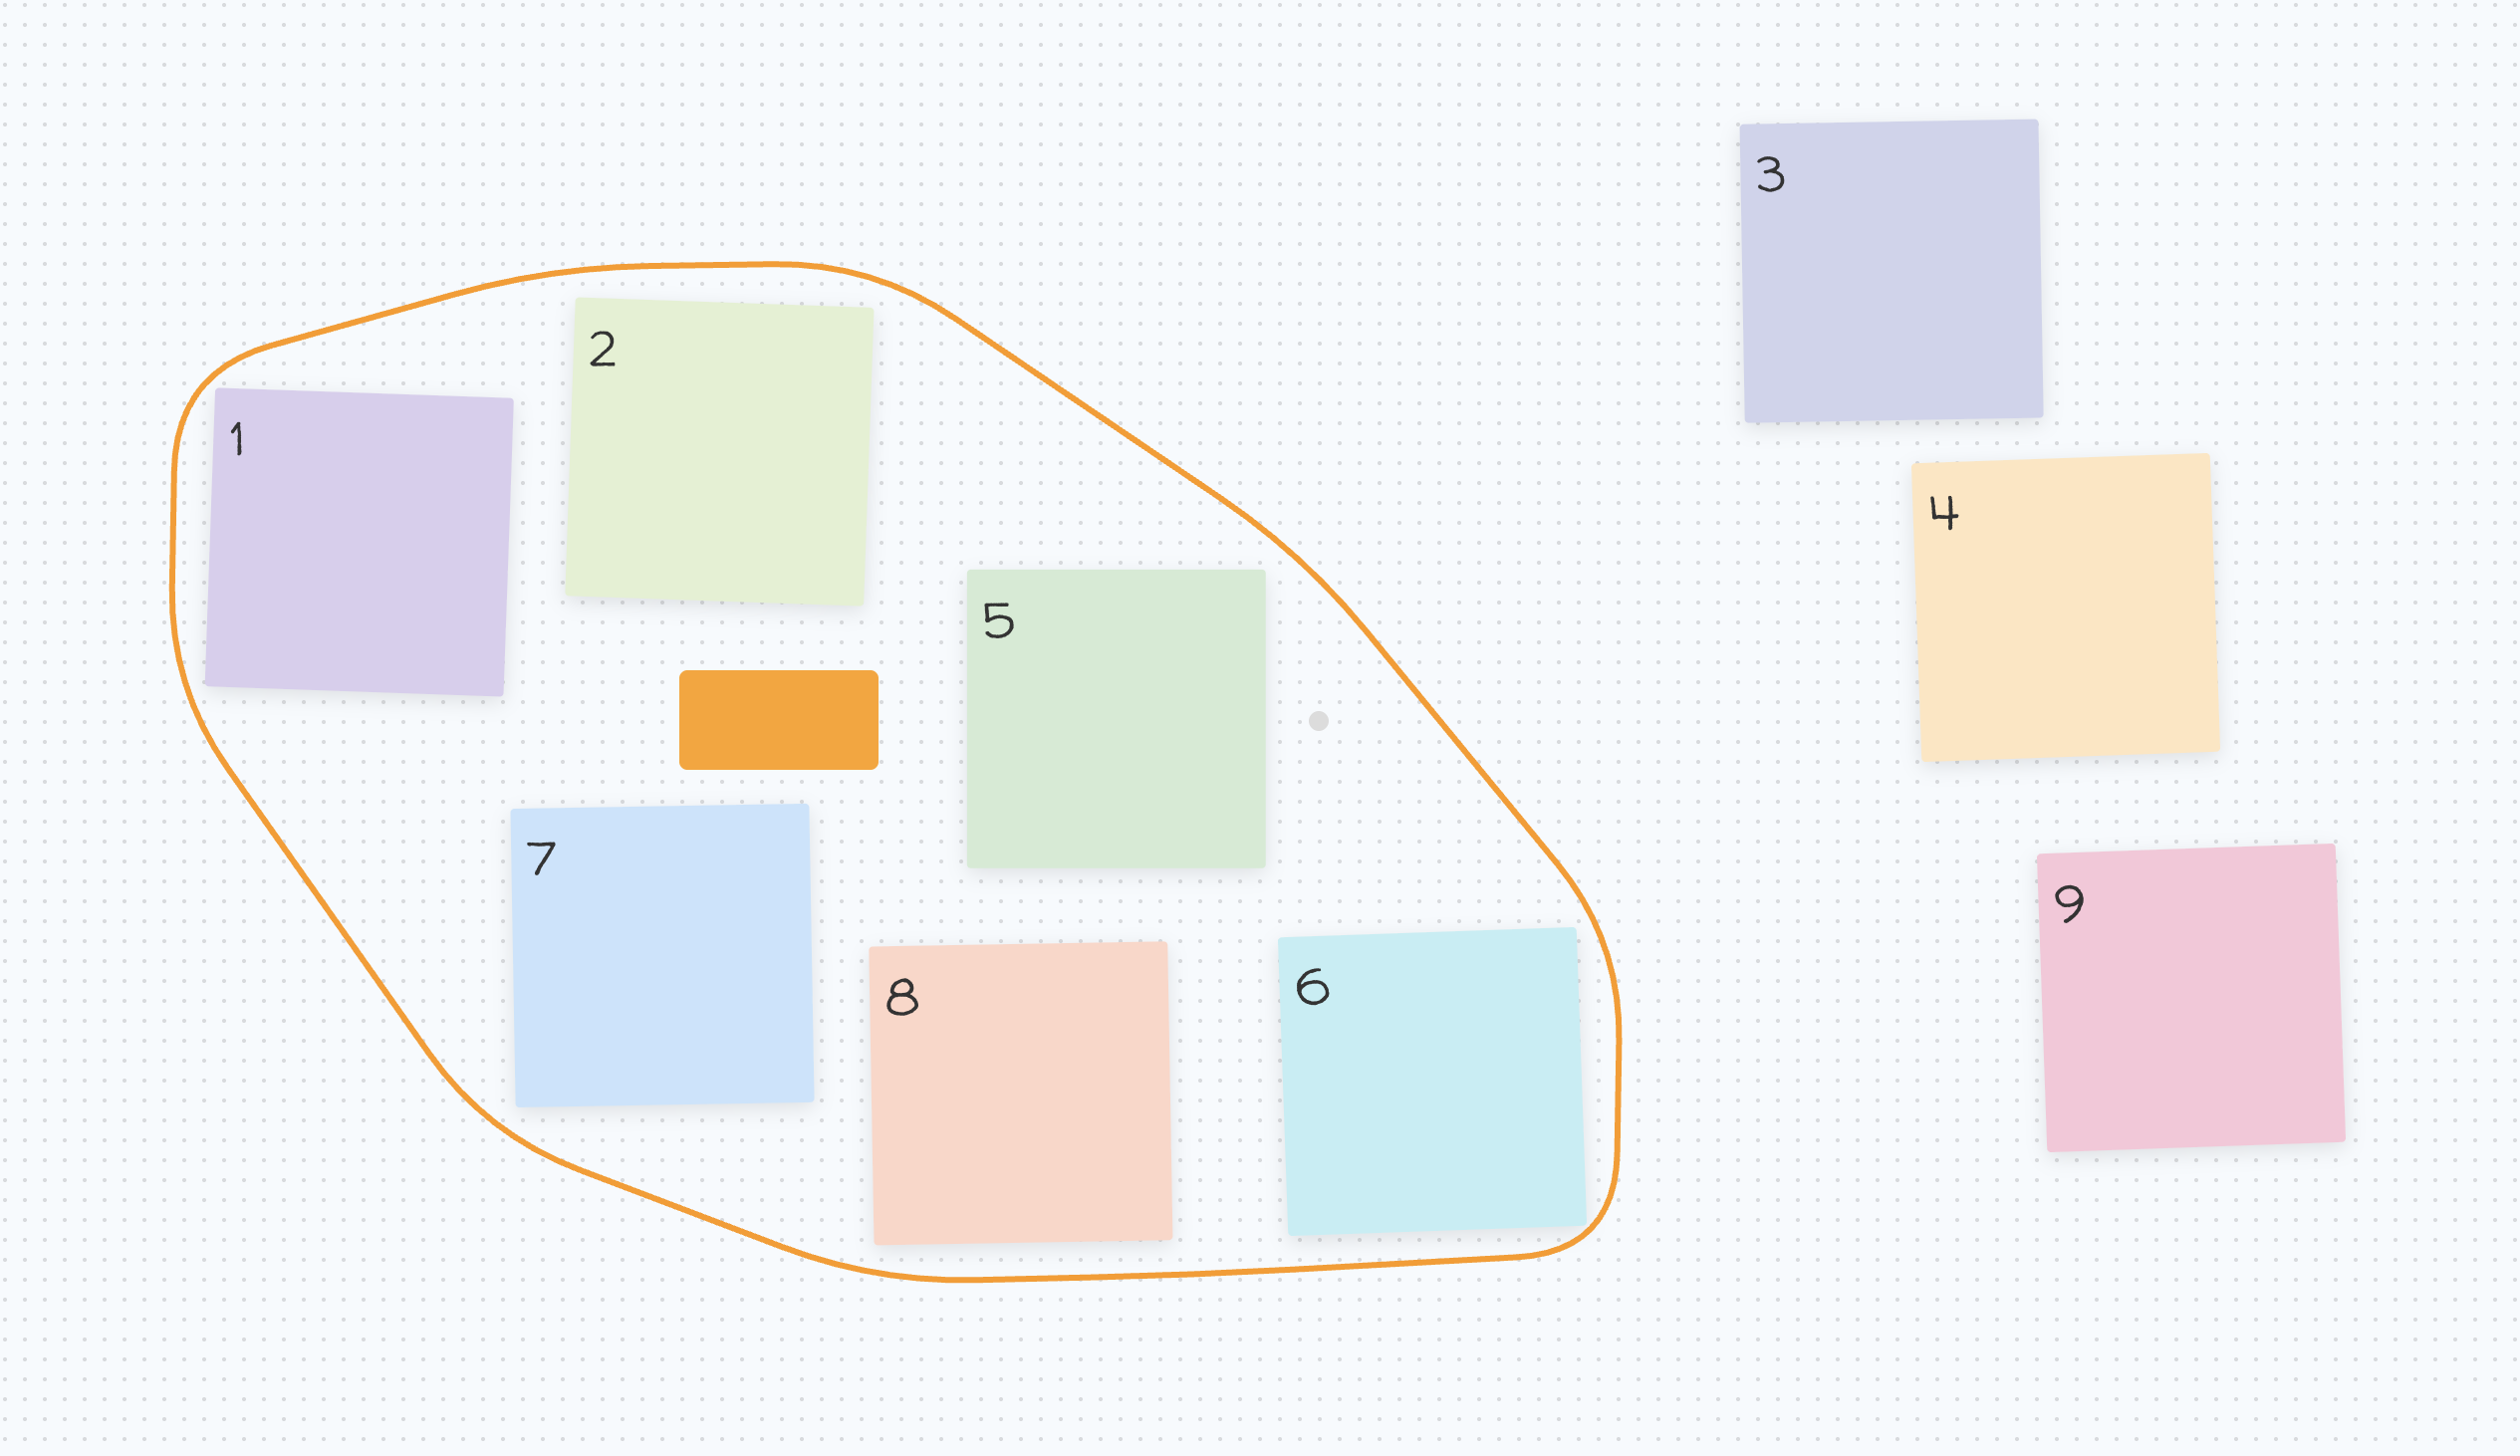
We can measure the distance between two rectangles using AABB distance checking. Let’s define “near” as <= 100px. If we compute the AABB distance between each Sticky and the Topic, we’d find:
- Stickies 1, 2, 5, 7 & 8 are near to the Topic (clearly less than 100px away)
- Stickies 3, 4, 6, 9 are not near to the Topic (way more than 100px away)
But what about #6? It’s not near the Topic using AABB distance, but it looks very much to us humans like it should be associated, because it’s near the cluster as a whole.
Attempt 1: Pathfinding
So, we need to figure out if a Sticky is not just near a Topic, but also if it’s near a cluster of Stickies that are themselves near a Topic. And this needs to work for a handful of Stickies or hundreds.
Fortunately, this is a straightforward pathfinding problem with the these rules:
- We treat each Sticky/Topic as a node in a graph
- We define edges (connections) between each Sticky/Topic and any other Sticky/Topic where the AABB distance between them is
<= 100px - We treat Topics as goal nodes
With this model, we can use A* to explore from each Sticky and determine if it should be part of a Topic cluster, and if so which one. As long as it can find a path from a Sticky to the Topic, then we know that the Sticky is near the Topic cluster. If not, then it is not near the Topic cluster.
Here’s an interactive demo of this in action. Drag the Stickies around and see how the paths are computed. This is close to what I shipped in the first version (I lost the original code so had to remake it for this article).
Pathfinding boffins will note that this is a multi-goal problem. We need to be careful to choose a heuristic for A* that is “admissible”, meaning that it never over estimates the cost toward a particular goal. Therefore we need to use the direct distance to the nearest Topic from a given Sticky to compute the heuristic.
In situations where we have a very close Topic that is not actually connectable, other Topics further away would be found suboptimally due the pollution of the heuristic in this case.
Dijkstra’s algorithm is arguably a better choice here, but I already had a working A* implementation from another project and when you have a hammer everything is a nail.
After launch, Topics quickly became one of our most-used features. But over time, some users complained it was hard to control which Topic a Sticky belonged to, especially on boards with a lot of Stickies that were all close together.
Sometimes positioning a Sticky would create a connection that was previously not possible (bridging the 100px gap) and cause whole chunks to flip to a different Topic. You can see this in the demo below. Try moving the marked Sticky to where the arrow is pointing.
This is a fundamental flaw in the approach, not easily worked around. We could prevent reassignment unless a Sticky was explicitly moved, but even a small move could still cause a flip.
Attempt 2: Asymmetric assign/unassign
After spending some time playing with the working version, two things occurred to me;
- Assigning Stickies needed to be more deliberate. In the first version, Stickies join a cluster when they come within 100px of any member. This is too sensitive. Assignment can happen without it feeling intentional.
- Unassigning also needed to be more deliberate. Stickies leave when they exceed 100px from any of their peers. If a move skirted that boundary, the Sticky would flip in and out of assignment rapidly, which feels bad.
The approach I settled on was to use a different strategy for addition vs removal, instead of a single strategy of picking the nearest connected Topic.
For assignment: check whether the Sticky’s bounds intersect the Topic boundary. If so, assign it.
For removal: keep pathfinding, but only check for a path back to the assigned Topic. Also, require the user to pull clearly beyond the boundary before unassigning.
Now assignment requires explicitly placing a Sticky inside the boundary, and removal requires pulling it well clear. Both feel much more deliberate.
Here’s the last demo again, but with this approach instead. Try moving the marked Sticky to where the arrow is pointing again.
Problem 2: Drawing the line around everything
Finding the hull
Now that we have covered Topic assignment, lets look at the second problem (and the one that inspired this article); how to draw a line around all the boxes.
Lets break the problem down. Our inputs are a group of elements: Stickies and a Topic. These can be reduced down into a bunch of bounding rectangles. These can then be further reduced down into an array of points (from the box corners).
From these points, we compute tight fitting border around the points, as if each point were a peg in the ground and the border was a resistance band stretched around them.
My geometry knowledge has improved a lot since starting Ludi, but back then it was not my strong point. My initial approach was so dumb I can’t handle the shame of writing about it, so I’ll skip to the part where I Googled and discovered what I was after is called a Convex Hull. There’s also a neat algorithm to compute it: QuickHull.
- Find the leftmost and rightmost points. These must be part of the hull. Draw a line between them, splitting points into two groups (above and below).
- For each group, find the point farthest from the line. This point must also be on the hull. Connect it to the endpoints, forming a triangle.
- Discard any points inside the triangle. They cannot be on the hull.
- Repeat step 2-3 for the remaining points outside each new edge, recursively, until no points are left outside.
The result is the convex hull.
Below is an interactive visualization of QuickHull in action. Before you try it, here some notes to help understand what is happening:
- The process mentions capturing points “inside” and “outside” an “edge”. Edge means line segment in this case, and each segment is directed. Inside means on the right of the line as per its direction and Outside means to the left. I’ve added the segment direction to the visualization but it doesn’t mean anything beyond this.
- Once a triangle is produced, it will be processed clockwise and each time any segments that have points “outside” will be recursed. Keeping this in mind when watching really helps to grok what is going on.
Rounding the hull
The convex hull gives us a tight but ugly polyline around the elements. All that is left is to make it look nice, for which we do two things:
- Add some padding so the line sits away from the elements a bit
- Round the edges to soften everything up.
Padding
To add padding we inflate each of the Sticky/Topic bounding boxes by 20px before reducing them to points. This creates a larger area around which the convex hull will be computed. This is a preferable strategy to the alternative of scaling out the points of the hull from the center, as this would result in unequal padding around the elements depending on where they were in the polygon.
Rounding
Next we convert the hull polyline to SVG Path Data. To add rounding, each point in the hull becomes a cubic bezier curve. We generate the control points for each curve by using the normalized vectors to both the previous and next points in the sequence, multiplying these vectors by a constant (in this case 50px) and adding these to our original point.
Breaking this down for anyone who hates geometry, for each point:
- Find the prev/next point (either -1 or +1 in the list)
- Compute vector from subject point to prev/next; a vector is a representation of direction and distance defined as an
xand ayvalue - Normalize the vector; change the vector so that it still represents a direction but with a distance of 1 (
xandywill usually be a fraction of 1) - With this normalized vector we can produce a new point, which is
Ddistance away in the direction of the prev/next point by multiplying the normalized vector byDand adding to the original point - In this case, we use
D=50px, sonewPoint = oldPoint + (normalizedVector * 50)
The only fiddly bit is the first/last points, where you wrap around to the end/start of the array. Otherwise it’s pretty easy. Here’s a demo where you can toggle on and off the padding to see how this looks:
And there you have it!
Some Notes On Performance
I don’t want to go too much into performance here, as it would have made the article too long.
That said, we do a number of things to ensure this all runs smoothly that I’ll briefly list here:
-
Topic assignment is computed per Sticky when a Sticky moves. So if you move one Sticky at a time, it’s gonna do one cycle of the logic per movement. This is the most common case when users are working on boards, which has low overhead overall.
-
Ludi boards have no limit in size, so we use a spatial indexing system based on rbush that allows us to query for elements based on their location efficiently. Topic assignment would die very quickly without this.
-
We only do collision detection on the inflated polyline hull, not the rounded version, as it’s a lot faster. It does mean if you touch a corner that is rounded a Sticky can get added seemingly a little early, but I mean… who cares?
-
In addition to the spatial index, we maintain a Topic index which maps which elements are in which Topic. This is kept up to date after all assignment operations so we can quickly and easily find which elements are on which Topic.
-
I haven’t really covered multiplayer, but to make things simple we store the absolute minimal state possible (e.g. a Topic ID is assigned to a Sticky in the model) and compute everything like the boundary, etc on each client from this state.
Wrap Up
And there you have it, that’s how to draw a line around a bunch of boxes. I hope you found it interesting! If anything here has caught your interest and you want to reach out to me, use the button in the header to send me a message.
Thanks for reading.
The main copy and structure of this article was produced by a human. AI tools were used for:
- The “QuickHull in Plain English” was created by Claude Code
- Links were inserted by Claude Code
- Some editing suggestions were accepted from Claude Code
- Interactive demos were created using Claude Code

Written by Steve Whitfield, co-founder of Ludi — a collaborative whiteboard for teams. You can try it today for free.